 The Universal Adapter Web Console allows you to manage and monitor all your integration processes from a single user friendly console
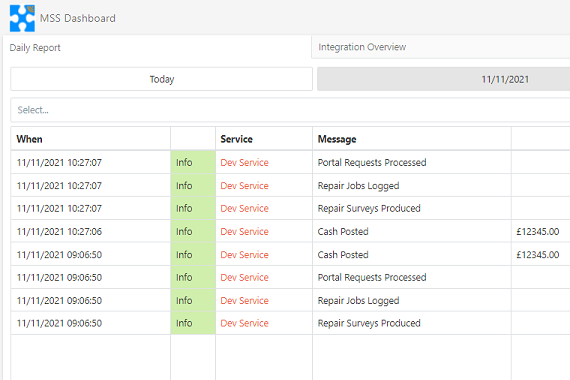
Monitoring integration between systems used to involve logging on to multiple servers and wading through log files, but not any more. The Universal Adapter constantly sends meaningful data to the cloud, so you can see the information passing through your systems at any moment. Custom dashboards and management tools make the web console an essential part of your integration infrastructure.
Monitoring Data and Trends
The web console not only logs errors and warnings, but can also log information about data passing through the interfaces eg.
- Total amount of cash posted
- Number of repairs completed by the contractor
- Number of people adding repairs via the self-service portal
This information can be presented as a graph or a report


Viewing the Status of Your Interfaces
The web console allows you to view the status of all your interfaces on one screen. You can select an interface and drill down into the detailed logs for that interface.
The Universal Adapter framework monitors all the interfaces and will automatically suspend an interface if it detects an issue. It will then notify you via Email and create a support ticket on our support system so we can investigate if you need us to.
The web console allows you to quickly check the status of everything running across all your systems. You can investigate an issue by drilling down into the detailed log files which provides a full diagnostic trace. Once you are happy with the reason the interface was suspended, you can reset the thread to resume the interface, all from within the web console.


Summary of Features
Show status of all UA services – Easily see the status of all services registered to you
Show status of all UA interfaces – Easily see if interfaces are running or have logged an issue
Access all UA log files – Open and read UA detailed log files for all interfaces
Search and report on errors and warnings – Identify any issues by searching across all your interfaces
Restart suspended interfaces – After investigating an issue, restart the interface remotely
Create a custom dashboard – Display important information on your own custom dashboard
Analyse trends – Add graphs that show changes over time
Highlight important data – Show essential information in a card on the dashboard
Filter and search – Search for information on one or more interfaces
Export data – Export information and trends
Multiple access levels – Users can view information, Admin users can manage the interfaces